This is Dwelanor’s central directory of evidence-backed U.S. housing and home-life statistics. Instead of repeating a number from a chart without context, each linked reference identifies the topic, time period and the underlying source so writers can trace claims back to government or other primary data.
Use this page to find data about home size, renting, home improvements, housing age, household composition, home energy and working from home. The entries are topic guides, not a claim that every published number comes from the same year: data releases in 2026 may summarize surveys conducted in earlier years.
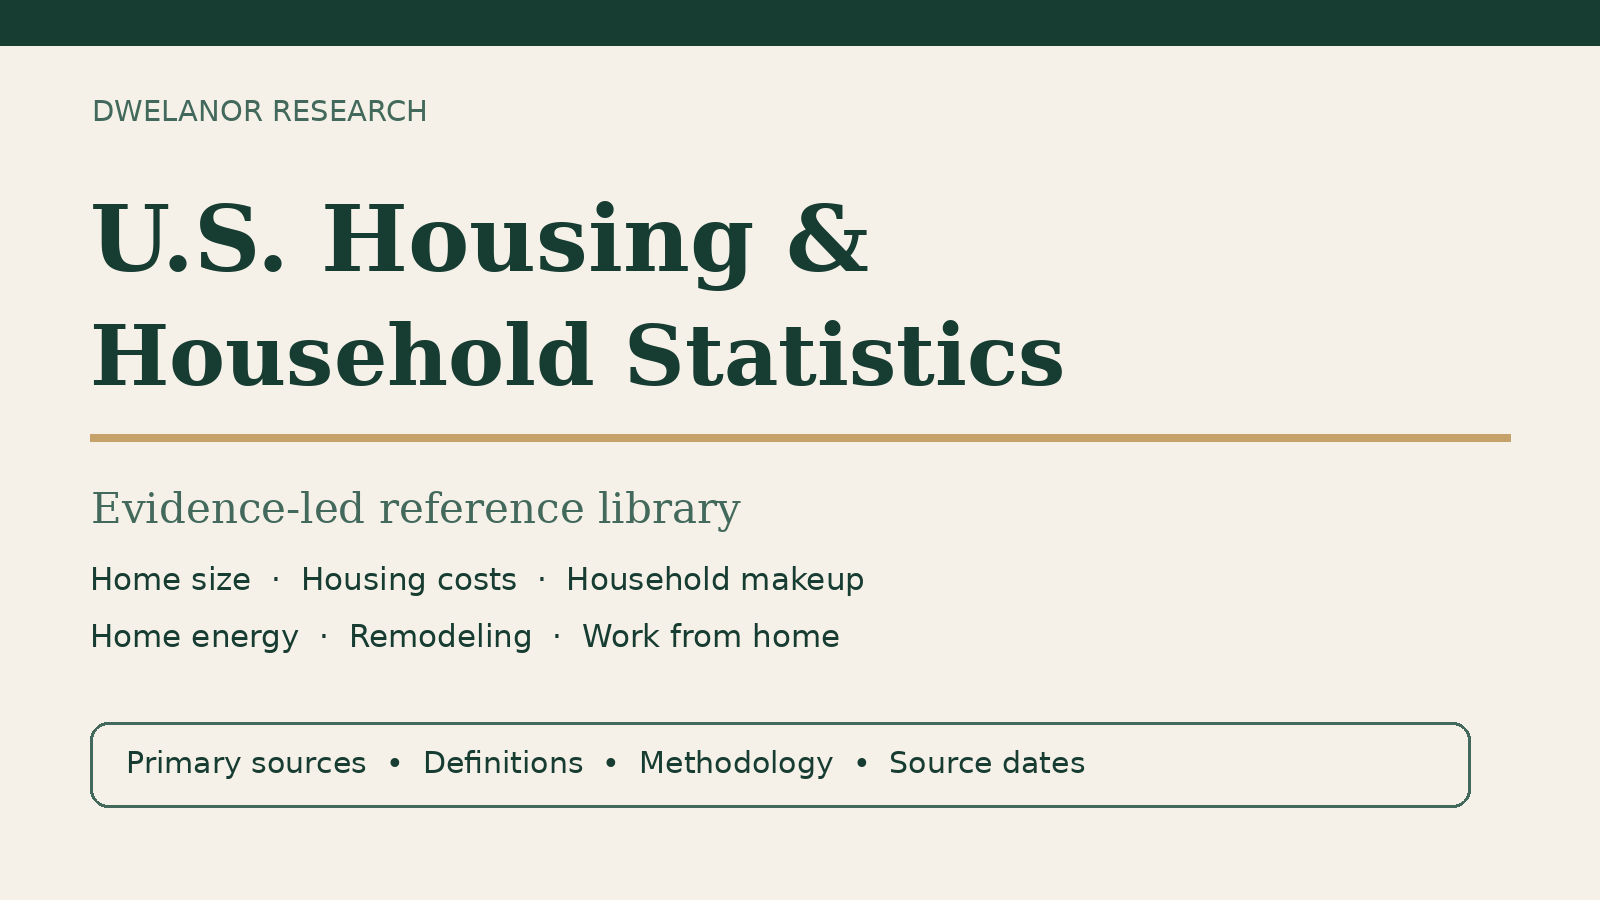
Find the right evidence for your home story
Start with a topic and follow its dedicated guide to the exact source year, table, definitions and relevant caveats.
Home size
Floor area and room counts
Housing costs
Rent, affordability and comparisons
Households
Family and household size data
Homeownership
Renting, owning and vacancies
Government survey estimates describe specific populations and dates. Do not combine measures from different survey years or denominators as if they were one dataset.
Latest source releases: October 2026
The Census Bureau released its 2025 American Community Survey 1-year estimates on October 29, 2026. Dwelanor’s related research guides now use verified 2025 estimates for the headline measures below. The quarterly Housing Vacancy Survey is separate: its third-quarter 2026 release was published October 28, 2026.
| Measure | Latest verified estimate | Detailed research |
|---|---|---|
| U.S. housing median year built | 1982 (2025 ACS) | Housing age statistics |
| Median U.S. gross rent | $1,557/month (2025 ACS) | Housing costs |
| Average U.S. household size | 2.49 people (2025 ACS) | Household composition |
| Workers who usually worked from home | 12.9% (2025 ACS) | Remote work |
| Residents age one or older who moved in the past year | 11.6% (2025 ACS) | Moving and mobility |
| U.S. homeownership rate | 65.5% (Q3 2026 HVS) | Renting and homeownership |
Interpretation note: ACS percentages and quarterly Housing Vacancy Survey figures have different denominators and reference periods. These are government survey estimates, not verified counts of every home or person. Consult each linked guide for methodology, definitions, uncertainty and historical comparisons.
Browse the housing and home-life data library
| Research topic | What you will find | Evidence base |
|---|---|---|
| Home size & room counts | 2026 reference covering U.S. home sizes, rooms and recent housing trends. | Original U.S. Census housing tables as cited on the article |
| Renting vs homeownership | Comparative homeownership, rental tenure, vacancy and housing-cost context. | U.S. Census ACS and housing data as documented on the page |
| Remodeling and home improvements | Spending and renovation context, with a distinction between household spending and market forecasts. | Official survey and industry research links documented on the page |
| Work from home | How remote work and home offices relate to changing residential needs. | BLS and other government data with years and survey denominators identified |
| Age of U.S. homes | Construction era and why housing age affects floorplans, services, maintenance and materials. | ACS housing-age tables identified in the article |
| U.S. household sizes | Household versus family definitions, people per household and living arrangements. | ACS/Census official definitions and dated tabulations |
| Residential energy use | Heating, cooling and residential electricity context; check the exact survey year. | EIA and other official energy source pages cited in the guide |
| Housing costs | Rent, mortgages, housing expenses and affordability, with proper denominators. | ACS and official housing-cost tables documented in the guide |
| Moving and mobility | How often people move and where they go using dated population/mobility data. | Census migration and mobility information cited on the article |
Each linked page provides source references and further reading. Before citing a figure, follow its linked guide to the primary source and confirm the reference year and definitions. No link in this directory is intended to imply a dataset was newly collected by Dwelanor.
What makes a home statistic reliable?
Check the survey period before quoting the publication year
A report titled “2026 statistics” may use results from a 2024 or 2025 survey. Readers need both the underlying observation period and the report’s publication date. For example, the latest BLS American Time Use Survey annual results covering 2025 were released in June 2026. Do not call them “2026 time diaries.”
Check the unit and denominator
“Per household,” “per person,” “all housing units,” and “owner-occupied homes” represent different populations. A table describing new single-family homes does not necessarily describe the total existing housing stock. Compare the unit and the denominator before joining numbers from unrelated datasets.
Check whether figures were measured, estimated or projected
Government survey point estimates have sampling uncertainty; industry market forecasts are projections based on assumptions. They may both be useful, but they are not interchangeable. If the original data series is revised or a newer edition is released, cite which vintage of the figure was used.
Do not use a chart as an independent substitute for the primary source
We encourage accurate reuse of the reference tables and illustrations, with a link back to the relevant Dwelanor compilation where it adds value. For underlying official data, cite the original agency directly as well. The goal is to make source discovery easier, not to claim exclusive ownership of government information.
A new household-time reference: cleaning, cooking, laundry and maintenance
Separate from housing dimensions and prices, the 2025 BLS American Time Use Survey measures daily activities of U.S. people aged 15 and older. It reports 1.99 hours per day, on average across everyone, for broadly defined household activities. The survey also breaks out food preparation, interior cleaning, laundry and other home-related categories.
Our accompanying U.S. Housework & Household Activities Statistics: 2025 BLS Time-Use Data reference compiles the published categories into approximate minute figures and participation percentages with an original chart, reusable table and copy-ready CSV. For the original federal figures, cite the official BLS ATUS report.
How to use these resources for practical home decisions
Housing and time-use statistics can provide context for planning a room, but they do not identify the correct furniture or product for one home. If national data show larger or smaller dwellings, it still takes measurements of the actual room and furniture to choose a piece that fits. Avoid presenting national averages as building-code clearances or universal design requirements.
The Interior Design Measurements Reference is a practical companion for measuring doorways and furniture; it uses planning guidance rather than claiming to describe national averages.
If your focus is making a home work better, start with our Storage & Organization Guide, Small Space Design Guide and Home Office Design Guide. These convert broad context into household-level planning decisions, without confusing observational statistics with product-performance evidence.
Research questions this library can support
- How large are typical U.S. homes, and how has their size changed?
- What are the boundaries of housing-stock and newly built-home statistics?
- How do housing affordability figures differ between renters and homeowners?
- How do residential construction eras influence home-maintenance context?
- What does working at home actually mean in official household surveys?
- How much time do people spend on the home each day?
- Where should a researcher locate the primary source and methodology?
Suggested attribution and editorial policy
When using an original Dwelanor synthesis, chart, data dictionary or article-specific interpretation, link to that specific article, not only to this directory. When quoting official figures, cite their primary agency and preserve the precise survey or reference year. Do not treat figures from different denominators as directly comparable without careful work.
This page is a living directory. Revisions should be dated in each underlying reference, and changes to underlying survey definitions should be explained. It is not a personal home-inspection service, and its statistics do not replace professional advice on construction, safety or building regulation.
Primary sources and related research institutions
- U.S. Census Bureau — American Community Survey for housing, households and living arrangements.
- U.S. Bureau of Labor Statistics — American Time Use Survey for household activities and working patterns.
- U.S. Energy Information Administration — Residential Energy Consumption Survey for residential energy.
- Harvard Joint Center for Housing Studies for housing research and commentary.
Frequently asked questions
Are these original Dwelanor surveys?
No. We compile and explain source material from the agencies and researchers identified in each guide. Original Dwelanor contributions can include cross-topic navigation, annotated tables, chart design and transparent calculations.
May I reference a figure in an article or report?
Yes, use the exact source year, unit and defined population, and link to the primary data plus the Dwelanor resource when using its synthesis or compilation. Check any licensing terms attached to third-party content before reproducing their own figures.
Does this directory recommend specific products?
No. Its primary purpose is factual research and useful citation pathways. Product selection is handled separately in Dwelanor’s buying guides, with commercial links explicitly disclosed when they are present.