Americans aged 15 and older spent an average of 1.99 hours per day on household activities in 2025, according to the U.S. Bureau of Labor Statistics (BLS). That all-person average covers time on chores such as food preparation and cleanup, interior cleaning, laundry, household management, lawn and garden care and maintenance. The figures come from the American Time Use Survey (ATUS), released June 25, 2026, and describe how people reported using time—not how long a cleaning task should take.
This reference compiles the newest annual figures into a clearly labeled table, approximate minutes per day and a copy-ready CSV and documented methodology. Researchers, journalists, educators and home-improvement writers may cite the figures with attribution to the BLS. These are 2025 survey data published in 2026, not measurements collected in 2026.
How Americans spent time on home tasks
The figures are all-person daily averages for people aged 15 and older, not durations for people who performed each task.
Household activities
All household activity time per day averaged across everyone in the survey population.
Food prep + cleanup
Approximate daily minutes from BLS’s rounded 0.71 hours.
Interior cleaning
Approximate daily minutes from BLS’s rounded 0.33 hours.
Any household activity
Share of people who reported some household activity on an average day.
Source: 2025 American Time Use Survey, U.S. Bureau of Labor Statistics. The selected subcategories are not an exhaustive decomposition and should not be added together.
Key figures: how long do people spend on household tasks?
- 1.99 hours daily: average household activities time for all persons age 15+, whether or not they performed any household activity on a particular day.
- 0.71 hours daily: food preparation and cleanup, the largest selected category listed in the BLS household activities chart.
- 0.33 hours daily: interior cleaning, averaged across everyone age 15+.
- 0.17 hours daily each: laundry and household management.
- 80.9%: share of people who did at least some household activities on an average day.
Official source: BLS: Average hours per day in selected household activities, 2025 and BLS: share engaging in selected household activities. The annual estimates were released in the June 25, 2026 ATUS report.
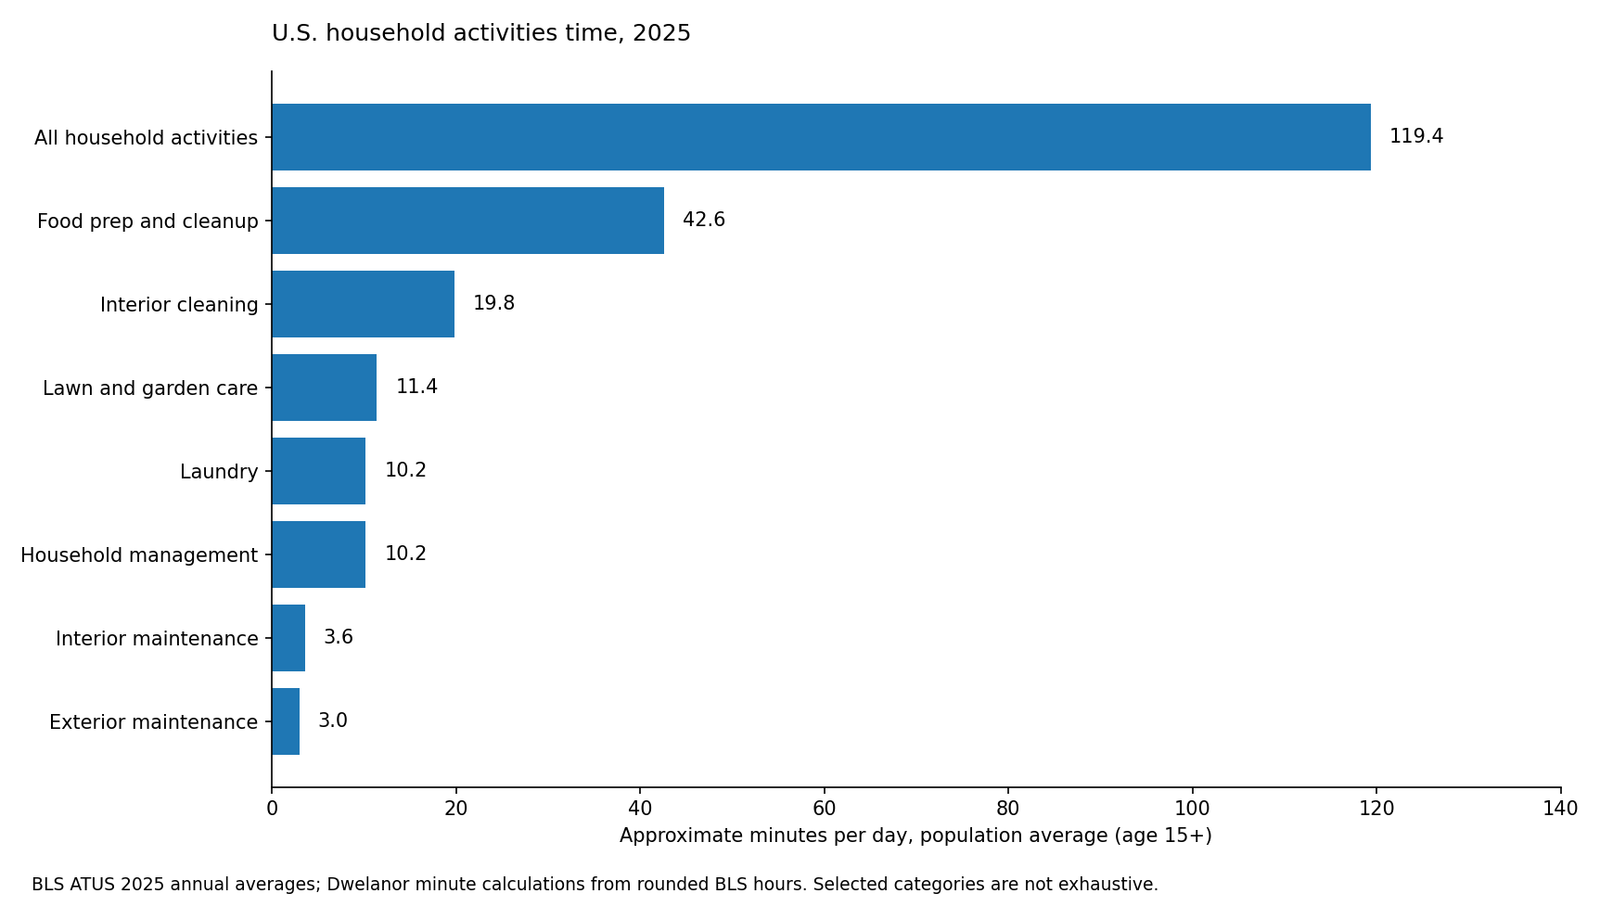
2025 household activities by category: hours, minutes and participation
The minute figures below are a Dwelanor calculation: published BLS average hours × 60. They are approximate because the BLS table rounds hours to two decimal places. Participation rates are a different statistic: the share who reported doing the activity on a diary day.
| Activity | Average hours per day (everyone) | Approx. minutes per day | Share participating each day |
|---|---|---|---|
| All household activities | 1.99 | 119.4 | 80.9% |
| Food preparation and cleanup | 0.71 | 42.6 | 65.2% |
| Interior cleaning | 0.33 | 19.8 | 23.4% |
| Lawn and garden care | 0.19 | 11.4 | 10.0% |
| Laundry | 0.17 | 10.2 | 16.3% |
| Household management | 0.17 | 10.2 | 18.6% |
| Interior maintenance, repair and decoration | 0.06 | 3.6 | 3.0% |
| Exterior maintenance, repair and decoration | 0.05 | 3.0 | 2.3% |
Important: the selected categories are not a complete, mutually exhaustive breakdown of the total. Do not add them and claim that their sum equals 1.99 hours. All measures use all-person population averages; they are not per-household or per-participant values. Data: BLS ATUS 2025. Minute conversion: Dwelanor.
How to read the numbers correctly
All-person average versus time spent by those who actually did the activity
Suppose a person did no laundry on their diary day. Their laundry time is zero, but they still contribute to the all-person average. The BLS table’s 0.17 hours (about 10.2 minutes) of laundry is therefore not a claim that a typical load of laundry takes ten minutes. It is an average across the whole population, including those who did not do laundry that day.
That difference matters for comparing activities. About 16.3% reported some laundry on an average day, while 65.2% reported food preparation or cleanup. Participation and the total population average answer separate questions and should not be used interchangeably.
Is the household total per person or per home?
The BLS surveys individuals and reports these figures for people age 15 and older, not a measured total for one household. Two people in a household may perform different activities or both do a task. Multiplying the figure by an estimated household size would not produce a reliable total household labor estimate without further assumptions and data.
Does a smaller category mean a task is unimportant?
No. A low all-person mean can reflect an infrequent task. Many people do not perform maintenance or decorate every day. The low daily average says little about the duration, difficulty or cost of an individual project. The published figures are descriptive time-use statistics, not rankings of what chores deserve attention.
Weekday vs weekend housework: what changed?
The BLS ATUS 2025 release reports 1.88 hours per day for household activities on weekdays and 2.26 hours on weekends and holidays. The difference is 0.38 hours, approximately 22.8 minutes, when comparing the published rounded figures. BLS ATUS Table 2 gives the definitions and breakdown for weekdays versus weekends and holidays.
The more detailed figures help explain the difference: housework averages were 0.50 hours on weekdays and 0.70 hours on weekends and holidays, while food preparation and cleanup averaged 0.70 and 0.74 hours respectively. These averages do not mean every household performs a particular chore at the weekend; they describe population patterns.
Who is included in the 2025 time-use statistics?
The ATUS is a survey of the U.S. civilian noninstitutional population age 15 and over. The BLS reports daily primary activities through respondent time diaries, with statistical weights used to represent the covered population. The underlying tables describe individuals, not square footage, household wealth, or the presence of a specific appliance.
The BLS also publishes results by age, sex, employment status and whether children live in the household. For example, the same official household-activity chart reports 1.58 hours for men and 2.38 hours for women as all-person daily averages in 2025. These group statistics are descriptive, not an endorsement of unequal divisions of household labor. Household roles, access to time and paid work are not fully explained by a single cross-sectional statistic.
For sampling, classification details, uncertainty and proper interpretation, consult the ATUS technical note. Do not claim small differences between categories or years are statistically significant without evaluating the survey’s variance and sample design.
What this tells us about planning a more practical home
The numbers cannot prove that a specific storage product saves time, but they do give useful context. Many people interact with kitchens, laundry zones and cleaning supplies frequently. Improving reach, visibility and the way the room functions may therefore be more valuable than optimizing an area that is rarely used.
Food preparation and cleanup: design around repeatable routines
Food preparation and cleanup account for a relatively large share of recorded daily household activity time. That supports a practical design question: can someone reach dishes, pantry ingredients, the sink and the cleaning materials without repeatedly crossing the room or unpacking overloaded cupboards?
To plan the physical arrangement, start with Dwelanor’s Kitchen & Dining Design Guide. For ingredient visibility and shelf access, see the Small Pantry Organization Guide. Neither guide claims a statistically established time saving; their role is helping the reader evaluate useful changes.
Cleaning and laundry: make storage easy to access
Keeping cleaning supplies near the area where they are safely used, choosing easily cleaned materials and providing practical laundry staging space can make daily tasks less cumbersome. But safety takes precedence: do not move chemicals into reachable food or children’s storage zones merely to reduce walking.
Our Storage & Organization Guide covers how to build zones that function in real homes. Its examples are household design guidance, not measured results from the ATUS.
Maintenance: plan access even when tasks are infrequent
Maintenance and repair categories have smaller daily averages partly because many days contain no such tasks. Yet access to panels, ventilation, electrical equipment and plumbing remains necessary. Do not hide building services behind difficult-to-remove decorative installations to make the room look tidy in a photograph.
Questions journalists and researchers can answer from this data
- What is the national daily average for household activities among people 15 and older?
- How much of an average day is allocated to food preparation and cleanup?
- What proportion of people report laundry or interior cleaning on an average day?
- Are household activity averages different on weekends and weekdays?
- How should a journalist distinguish an all-person average from a participant-only average?
Do not use this dataset to answer how many total hours a particular U.S. household spends cleaning or whether a specific home appliance reduces labor; the published table cannot establish those conclusions.
Copy the data and check the methodology
The data are provided here in copy-ready CSV format to avoid requiring a login or sending readers to an inaccessible file. Select and copy the text below into a new plain-text file named dw-atus-household-time-2025.csv. The same information and methodology are documented in the table and source notes above.
activity,avg_hours_day,approx_minutes_day,participation_pct
All household activities,1.99,119.4,80.9
Food preparation and cleanup,0.71,42.6,65.2
Interior cleaning,0.33,19.8,23.4
Lawn and garden care,0.19,11.4,10.0
Laundry,0.17,10.2,16.3
Household management,0.17,10.2,18.6
Interior maintenance repair and decoration,0.06,3.6,3.0
Exterior maintenance repair and decoration,0.05,3.0,2.3
Data dictionary: avg_hours_day = BLS all-person daily average hours for people aged 15+, approx_minutes_day = rounded published hours × 60, participation_pct = share of people engaging in that activity on a typical day. These selected categories do not exhaust the broad household-activities total. Full source links and limitations are cited directly in the article above.
Suggested source credit: “Source: U.S. Bureau of Labor Statistics, American Time Use Survey, 2025 annual averages (released June 25, 2026); minute conversions and selected-category compilation by Dwelanor.” Link to this Dwelanor reference when using the curated chart or its derived minute column, and retain a citation to the official BLS tables for the federal statistics.
Frequently asked questions
How much time did Americans spend doing housework in 2025?
BLS reports 1.99 hours of household activities per day on average for people aged 15+. That broad category includes food preparation, cleaning and other household work. Its narrower “housework” category has a separate definition and value; do not treat the two labels as identical.
Is the BLS number the amount of time the average homeowner spends cleaning?
No. The data cover individuals age 15 and older, including renters and people who did not perform the activity on a given day. They are not homeowner-only measurements and the total includes activities beyond cleaning.
Are the numbers for 2025 or 2026?
The diary data are from 2025, and BLS published the annual results in June 2026. A headline referring to “2026 statistics” means the latest report was issued in 2026, not that the survey measured 2026 behavior.
Can I cite or chart this dataset?
Yes, cite the federal BLS source for the original values, disclose that minute values are calculated from rounded hours and retain the age and all-person-average caveats. This compilation is intended to be linkable and reused accurately, not to exaggerate its novelty.
References
- U.S. Bureau of Labor Statistics: American Time Use Survey—2025 Results, released June 25, 2026.
- Average daily hours in selected household activities, 2025 annual averages.
- Percentage participating in selected household activities, 2025 annual averages.
- ATUS Table 2: Weekday and weekend daily averages.
- ATUS Technical Note.