

Housing Tenure Data
The U.S. homeownership rate was 65.5% in the third quarter of 2026. The Census Bureau reported a 7.6% rental vacancy rate and a 1.2% homeowner vacancy rate for the same quarter. The homeownership rate was not statistically different from Q2 2026 or Q3 2025, while rental vacancy was higher than both comparisons.
For renter costs, the 2025 American Community Survey estimated median gross rent of $1,557 per month, including rent plus renter-paid utilities where applicable. The older 2024 ACS reported a median gross-rent share of approximately 31% of household income, but that is a historical comparison, not a verified 2025 renter cost-burden estimate.
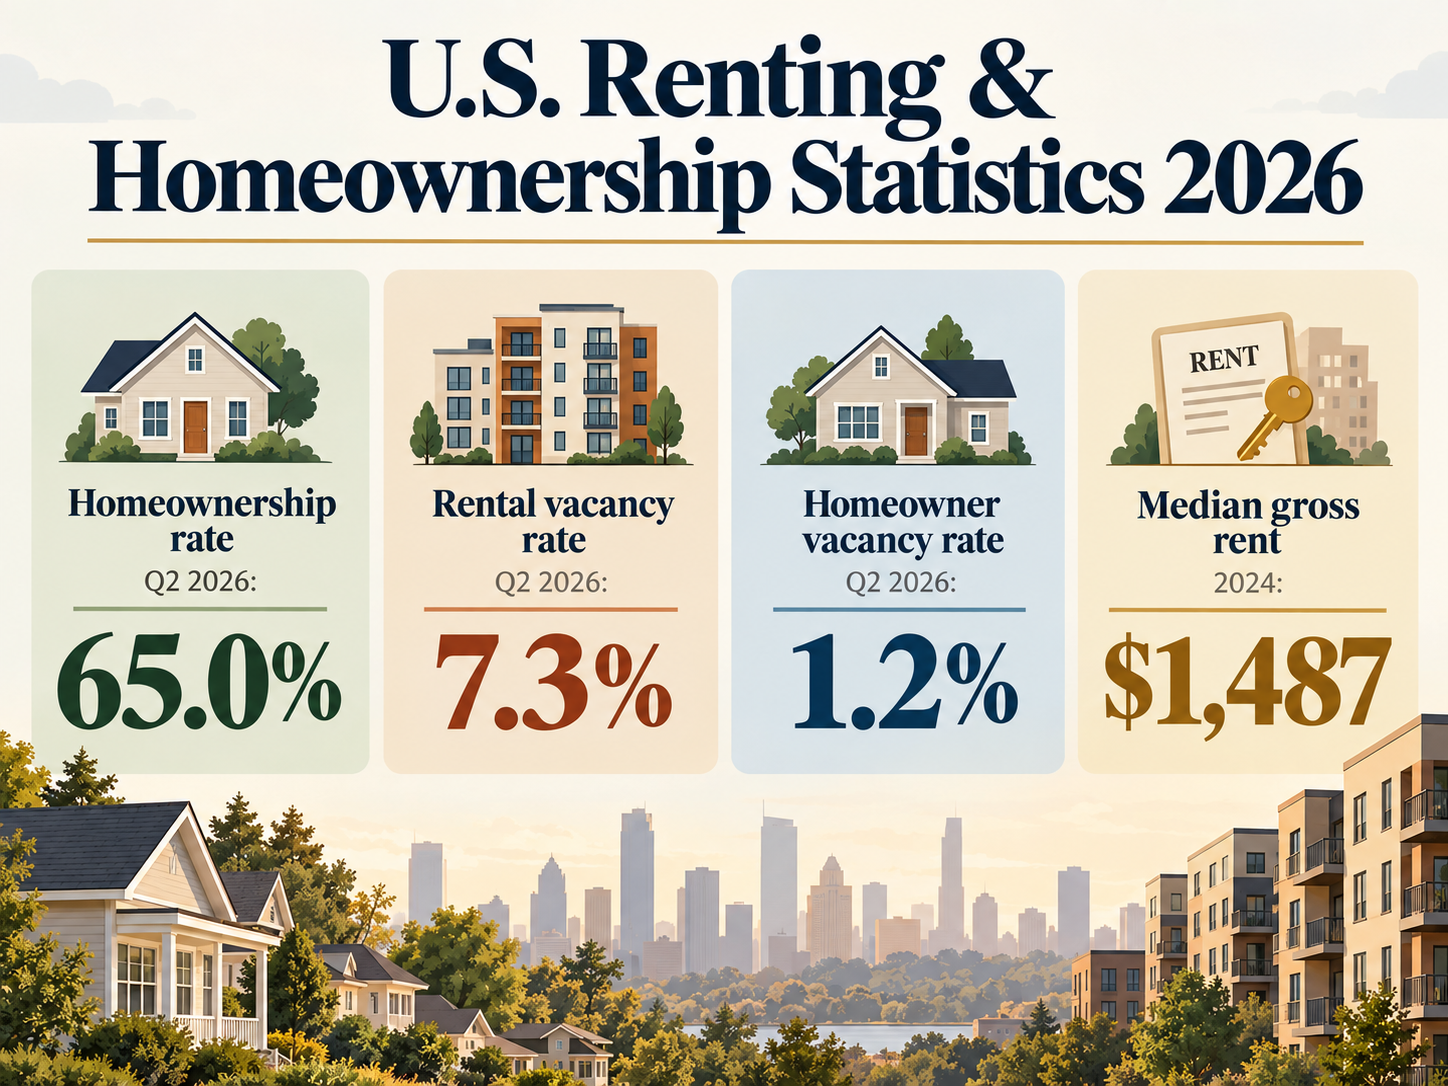
Key U.S. renting and homeownership statistics
| Statistic | Estimate | Source period |
|---|---|---|
| Homeownership rate | 65.5% | Q3 2026 HVS |
| Rental vacancy rate | 7.6% | Q3 2026 HVS |
| Homeowner vacancy rate | 1.2% | Q3 2026 HVS |
| Median gross rent | $1,557/month | 2025 ACS 1-year |
| Prior-quarter homeownership | 65.0% | Q2 2026 HVS |
| Prior-quarter rental vacancy | 7.3% | Q2 2026 HVS |
| Median gross-rent share (historical) | about 31% | 2024 ACS 1-year |
Primary sources: U.S. Census Bureau, Q3 2026 Housing Vacancy Survey (October 28, 2026); 2025 ACS Table B25064, Median Gross Rent; and 2024 ACS housing-cost release for historical comparisons. The quarterly HVS and annual ACS are different surveys.
Homeownership was 65.5% in Q3 2026
The Census Bureau reported a national 65.5% homeownership rate for Q3 2026, which was not statistically different from 65.0% in Q2 2026 or 65.3% in Q3 2025. Do not interpret the numerical increase as statistically established growth in the ownership rate.
This is a quarterly estimate from the Housing Vacancy Survey. It should not be mixed casually with ACS homeownership estimates because the surveys use different designs and publication schedules.
Rental vacancy increased to 7.6%
The rental vacancy rate was 7.6% in Q3 2026, higher than 7.3% in Q2 2026 and 7.1% in Q3 2025. The homeowner vacancy rate was 1.2%, virtually the same as the previous quarter and the year-earlier quarter. The figures do not measure how rents themselves changed.
A vacancy rate does not mean the same thing as the share of households that rent. It measures vacant housing available within the relevant tenure category.
Median gross rent reached $1,557 in 2025
Gross rent is broader than the rent number shown on a lease. Census includes contract rent plus the estimated average monthly cost of utilities and fuels when those costs are paid by the renter. That definition is why gross-rent statistics should not be compared directly with advertised asking rents from listing sites.
The 2025 ACS median gross rent was $1,557 per month, compared with $1,487 in the 2024 ACS. Gross rent includes contract rent plus estimated average monthly renter-paid utilities and fuels, so it should not be equated with listed asking rent.
The Census Bureau reported that this was 2.7% higher than the inflation-adjusted 2023 median of $1,448.
Rent consumed about 31% of income at the median
The Census housing-cost release reported that the median percentage of income going toward gross rent remained at 31% in 2024. The detailed 2024 ACS 1-year table reports 30.9% for renter-occupied housing units paying cash rent.
Those are median values. They do not show the full distribution, and many households spend materially more or less than the median.
Year-over-year context for the quarterly figures
The Census Bureau found Q3 2026 homeownership at 65.5%, not statistically different from 65.3% in Q3 2025 or 65.0% in Q2 2026. Rental vacancy rose to 7.6%, higher than both 7.1% one year earlier and 7.3% in the prior quarter.
That wording matters. Small numerical movements in survey estimates are not automatically meaningful changes, particularly when Census explicitly says a difference is not statistically significant.

Why survey differences matter
The quarterly Housing Vacancy Survey is useful for timely national tenure and vacancy trends. The ACS is a much broader annual survey with detailed housing, demographic and geographic characteristics.
When citing this page, keep every survey and reference period attached to its figure. For example, 65.5% homeownership in Q3 2026 comes from the Housing Vacancy Survey, while $1,557 median gross rent in the 2025 ACS is an annual estimate from a different survey.
Contract rent, gross rent and asking rent are different
| Term | What it describes |
|---|---|
| Contract rent | Rent agreed to or charged for the housing unit |
| Gross rent | Contract rent plus renter-paid utilities/fuels under Census definitions |
| Asking rent | Advertised or requested rent for an available unit; not the same survey measure |
Keeping these definitions separate avoids one of the most common problems in housing-statistics articles: mixing figures that look comparable but measure different costs.
What this means for renter-focused interiors content

Rental households represent a major, persistent part of the U.S. housing market, which supports maintaining a distinct renter-friendly interiors cluster rather than treating rentals as a niche afterthought.
Dwelanor’s Rental Decorating Guide focuses on reversible lighting, rugs, curtains, storage and other changes that do not assume ownership. The Small Space Design Guide covers layout decisions where floor area is constrained regardless of tenure.
What not to infer from these statistics
- A 65.5% homeownership rate does not mean that the remaining 34.5% of all housing units are occupied by renters; the tenure and vacancy measures use different denominators.
- The rental vacancy rate is not the share of households that rent.
- Median gross rent is not the typical advertised rent for a newly listed apartment.
- National figures can conceal large geographic differences.
- Quarterly HVS estimates and annual ACS estimates should not be combined as one continuous series without methodological care.
Methodology and citation notes
For related questions, compare this tenure and vacancy snapshot with our U.S. housing costs and rent burden statistics and U.S. moving statistics. Those pages use different measures and periods, so do not treat them as interchangeable estimates.
- Quarterly tenure/vacancy source: Current Population Survey / Housing Vacancy Survey.
- Latest quarter on this page: Q3 2026, released October 28, 2026.
- Annual rent-cost source: 2025 American Community Survey 1-year estimates, released October 29, 2026; any retained 2024 values are labeled historical.
- Gross rent: Contract rent plus renter-paid utilities/fuels as defined by Census.
- Do not mix: Quarterly HVS estimates and annual ACS estimates have different methodologies.
Frequently asked questions
What was the U.S. homeownership rate in Q3 2026?
The Census Bureau reported 65.5% for Q3 2026, not statistically different from Q3 2025 (65.3%) or Q2 2026 (65.0%).
What was the rental vacancy rate?
The national rental vacancy rate was 7.6% in Q3 2026, a measure of vacant rental housing available for rent, not the share of households that rent. It was higher than in Q2 2026 and Q3 2025.
Is median gross rent the same as advertised rent?
No. Census gross rent includes contract rent plus renter-paid utilities and fuels under its survey definition. An advertised asking rent from a listing platform measures something different.
Suggested citation
Dwelanor Editorial. “U.S. Renting & Homeownership Statistics 2026: Tenure, Vacancy & Housing Costs.” Updated September 2026. Data compiled from the U.S. Census Bureau Housing Vacancy Survey and American Community Survey.
Bottom line
The newest quarterly release puts homeownership at 65.5% and rental vacancy at 7.6% in Q3 2026. The newest annual ACS estimates median gross rent at $1,557 for 2025. Distinguishing the datasets, dates and definitions makes the statistics more useful for home and rental decisions.