
Remodeling Data Reference
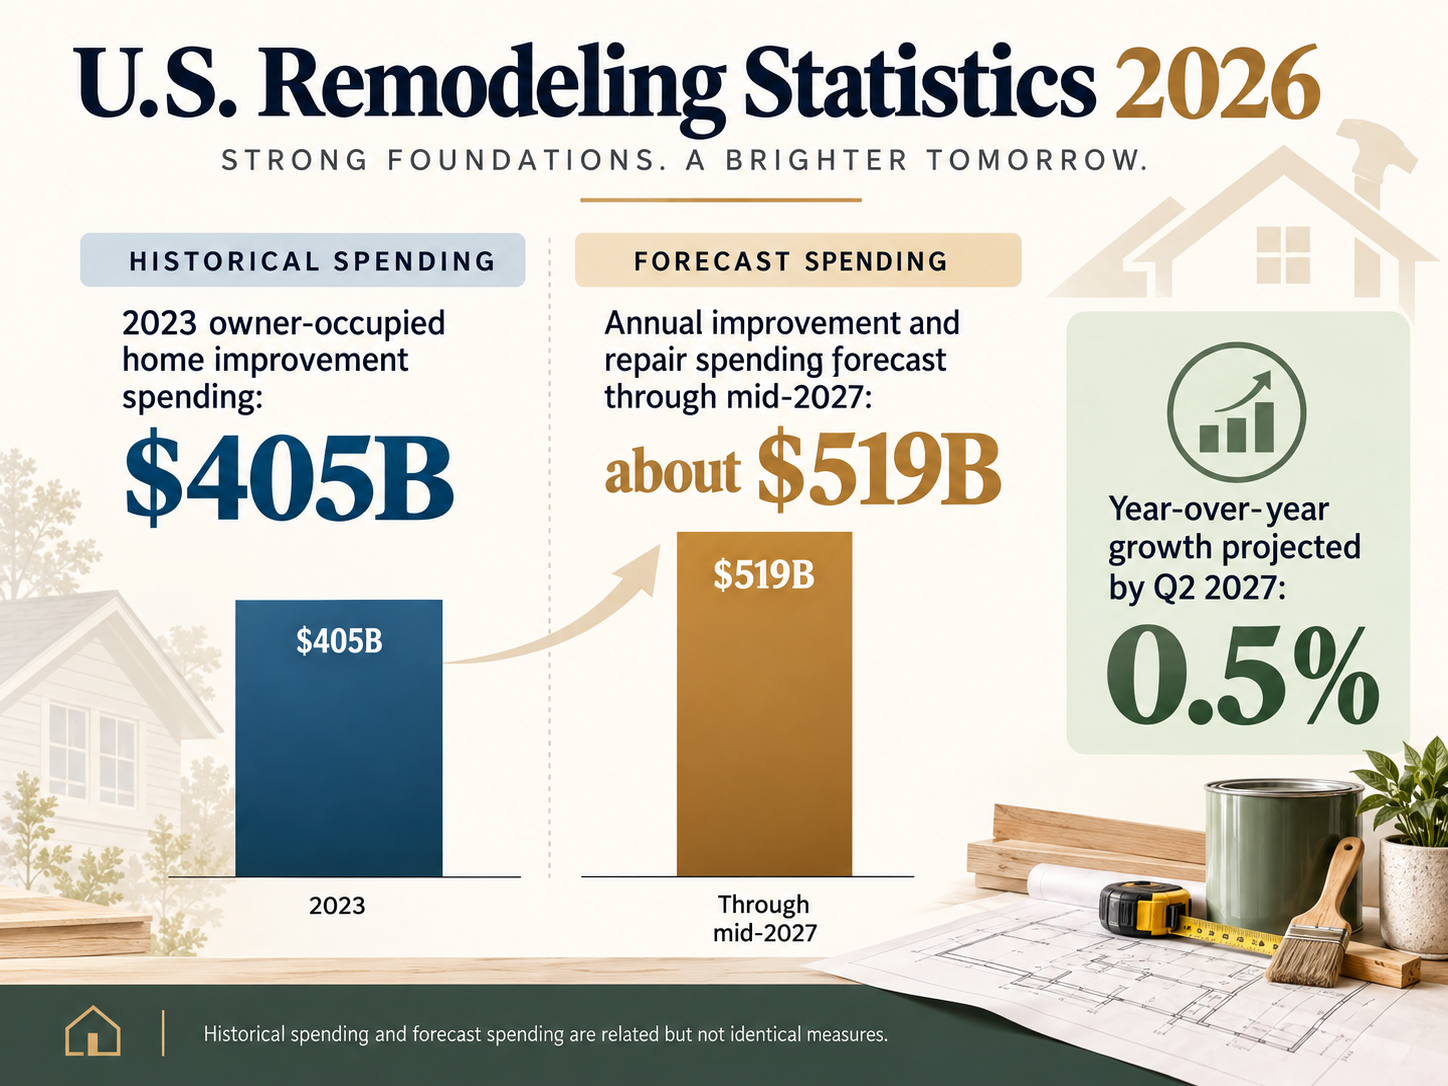
U.S. homeowner improvement spending reached $405 billion in 2023, while current Harvard JCHS forecasts put annual home improvement and repair spending near $519 billion through mid-2027. Those figures describe different measures and time periods, so this reference keeps observed historical data separate from forecasts.

Key U.S. remodeling statistics
| Statistic | Figure | Type / period |
|---|---|---|
| Owner-occupied home improvement spending | $405 billion | Observed, 2023 |
| Average improvement spending per owner | $4,700 | Observed, 2023 |
| Owners undertaking at least one improvement | About 25.8 million | Observed, 2023 |
| Share of owners undertaking improvements | 29.7% | Observed, 2023 |
| Owner maintenance spending | $105 billion | Observed, 2023 |
| Average maintenance spending per owner | $1,200 | Observed, 2023 |
| Replacement projects’ share of improvement spending | 49% | Observed, 2023 |
| Professionally installed improvement spending | $340 billion | Observed, 2023 |
| DIY improvement spending | $64 billion | Observed, 2023 |
| Forecast annual improvement + repair spending | $519 billion | Forecast through mid-2027 |
Primary research: Joint Center for Housing Studies of Harvard University, Improving America’s Housing 2025 and the July 23, 2026 LIRA remodeling outlook.
Homeowner improvement spending reached $405 billion
JCHS reports that improvements to owner-occupied homes reached $405 billion in 2023. That category covers discretionary and necessary improvement work and is separate from routine maintenance.
Average improvement spending was about $4,700 per owner in 2023.
Nearly 26 million homeowners undertook improvement projects
About 25.8 million homeowners undertook at least one improvement project in 2023. The share of owners with an improvement project was 29.7%, matching the two-decade high reached in 2021.
Maintenance added another $105 billion
Routine maintenance spending on owner-occupied homes reached $105 billion in 2023, with average maintenance spending of about $1,200 per owner.
This distinction matters because replacing a failed system, repainting a room and performing routine maintenance are not all measured as the same kind of expenditure.
Replacement work accounted for about half of improvement spending
JCHS reports that replacement projects accounted for 49% of aggregate homeowner improvement expenditures in 2023. These include core components such as roofing, windows and HVAC systems.
Discretionary projects such as kitchen and bath remodels and room additions accounted for roughly 30%, outside-property projects about 15%, and disaster repairs about 6%.
Project mix in dollars
JCHS breaks the $405 billion in 2023 homeowner improvement spending into several broad groups. Replacement projects accounted for about $197 billion, discretionary projects about $121 billion, outside-property improvements about $63 billion and disaster repairs about $24 billion.
| Project group | Share | Approx. spending |
|---|---|---|
| Replacement projects | 49% | $197B |
| Discretionary projects | 30% | $121B |
| Outside-property projects | 15% | $63B |
| Disaster repairs | 6% | $24B |
The categories are not a ranking of importance. They describe how aggregate spending was distributed in the 2023 American Housing Survey-based estimates.
Professional work dominated spending
Professionally installed improvements reached $340 billion in 2023 and represented 84.1% of homeowner improvement expenditures. DIY project outlays were $64 billion.
That does not mean 84.1% of projects were professional. It is a share of dollars spent, which is strongly influenced by project size and labor cost.
JCHS also reports that the typical DIY project cost about $2,600 in 2023, compared with about $7,800 for the average professional project. That gap helps explain why professional work can dominate spending even when homeowners still complete many smaller projects themselves.
The 2026-2027 forecast is a different metric
Harvard’s Leading Indicator of Remodeling Activity covers homeowner spending on improvements and repairs and is designed as a forward-looking market indicator. The July 2026 forecast expects annual spending to reach about $519 billion through mid-2027, with year-over-year growth slowing to 0.5% by the second quarter of 2027.
Do not compare the $519 billion forecast directly with the $405 billion 2023 owner-improvement figure without noting the difference in category and methodology.
What the current forecast does not mean
The $519 billion LIRA forecast is not a prediction that homeowners will spend $519 billion on kitchens, bathrooms or decorating alone. It covers a broader improvement-and-repair market and is expressed as a four-quarter spending level through mid-2027.
It is also a forecast, not observed final spending. As new housing, retail, permitting and broader economic data change, the outlook can be revised.
What the data mean for interior decisions
A large remodeling market does not imply every household is doing a full renovation. The data include a wide spectrum of projects, and the dominance of replacement spending shows how much expenditure is tied to maintaining the function of existing homes.
For Dwelanor’s practical planning content, this supports a distinction between decorating decisions, space-planning changes and construction or systems work. The latter often requires qualified trades, code checks or professional installation.
For room-specific planning, see the Bathroom Design Guide, Kitchen & Dining Design Guide, Home Lighting Guide and Interior Materials Guide.
What not to infer from the remodeling data
- Spending totals do not equal project counts.
- Professional spending share is a share of dollars, not a share of households.
- DIY spending excludes the value of homeowners’ own labor.
- The 2023 historical estimates and the 2026-2027 LIRA forecast are different measures and periods.
- National spending cannot be used to estimate the cost of a specific renovation without local scope and price data.
Methodology and citation notes
- Historical source: JCHS tabulations using HUD American Housing Survey data in Improving America’s Housing 2025.
- Historical period highlighted: 2023.
- Forecast source: JCHS Leading Indicator of Remodeling Activity, July 23, 2026.
- Forecast horizon: through mid-2027.
- Important distinction: Observed improvement expenditures and the LIRA improvement-and-repair forecast are not identical measures.
Frequently asked questions
How large is the U.S. remodeling market?
There is no single number that describes every remodeling activity. JCHS reported $405 billion in owner-occupied home improvement spending in 2023, while its current LIRA forecast covers the broader improvement-and-repair market and projects about $519 billion in annual spending through mid-2027.
Why are the historical and forecast numbers different?
They cover different periods and somewhat different spending definitions. The historical $405 billion figure refers to homeowner improvement expenditures in 2023. The LIRA is a forward-looking indicator for improvements and repairs.
Does professional spending share mean most projects use contractors?
No. The 84.1% figure is a share of improvement dollars, not project count. Professional jobs tend to be larger and include labor, materials, profit and overhead, while DIY spending records material outlays.
Suggested citation
Dwelanor Editorial. “U.S. Remodeling Statistics 2026: Home Improvement & Repair Spending.” Updated September 2026. Based on Joint Center for Housing Studies of Harvard University data and forecasts.
Bottom line
Homeowner improvement spending was already $405 billion in 2023, and the broader improvement-and-repair market remains near half a trillion dollars annually in current forecasts. The more useful story is not just the size of the market, but the mix: replacement work dominates spending, professional installation captures most dollars, and growth is expected to slow.